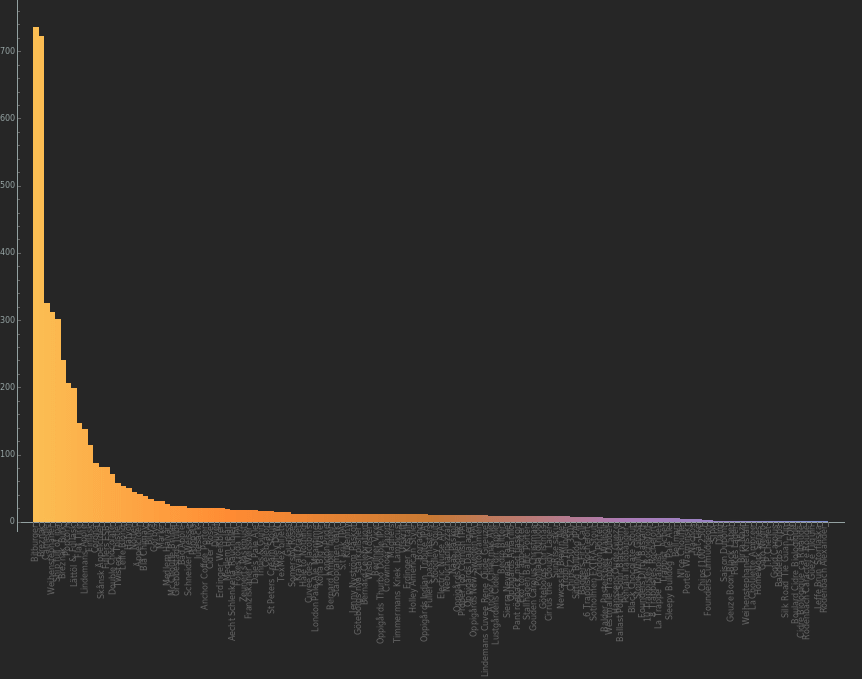
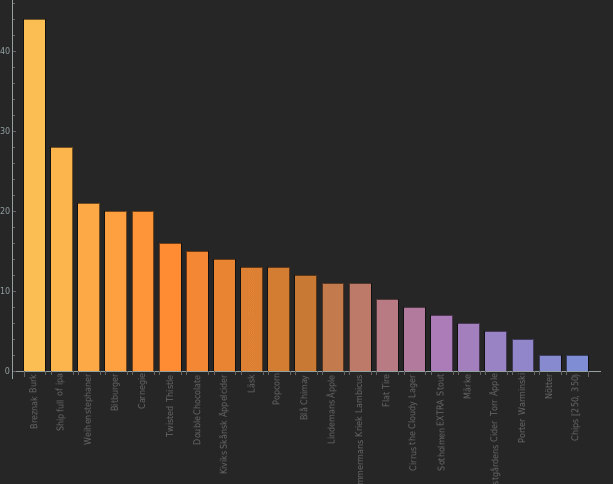
Ovanstående är ett exempel på logg för Stupan under januari månad 2018.
Test med tider


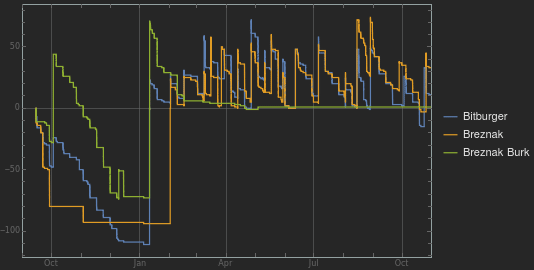
The plot should have that the whole change is noted on the Y axis, and all travel along the X axis should be
perfectly horizontal. I have however not figured out how to do that yet.
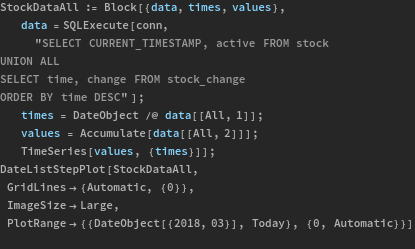
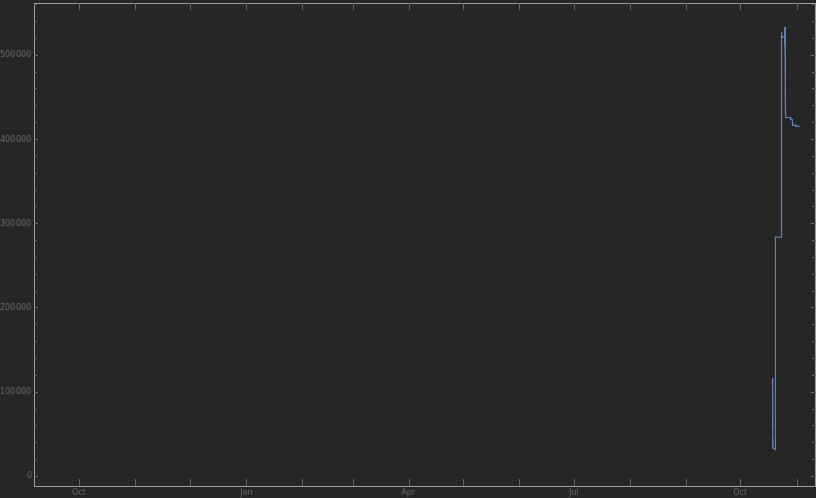

MoneyAll summerar helt fel, och bör *inte* användas.
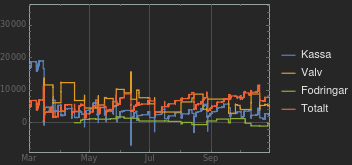
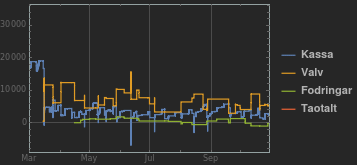
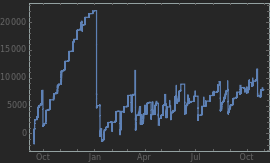
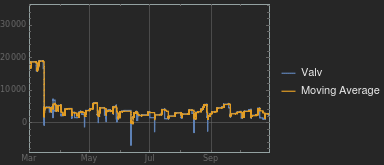
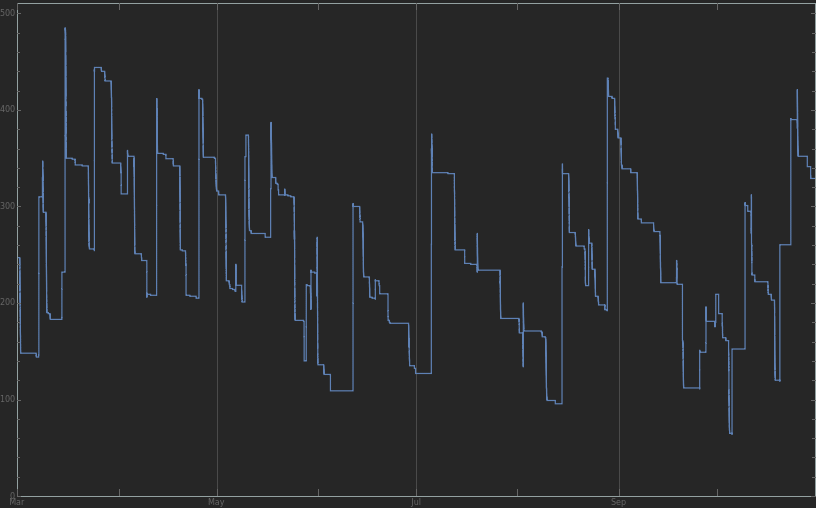
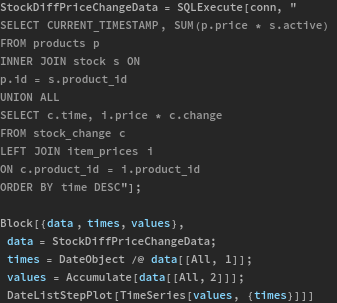
Nu kollar vi på totalvärde
först behöver vi inventarievärde


![]()

![]()


